Rider Students Apply Big Data Analytics to Real-World Problems
Rider University students recently tried their hands on a big data analytics problem provided by a well-known organization during DataFest, an annual data analysis competition sponsored by the American Statistical Association (ASA).
This year’s DataFest challenge was provided by American Bar Association (ABA). The ABA provides pro bono (i.e., free of charge) legal services via an online platform to low income families across the United States. The data contains conversations between clients and lawyers and basic demographic information about the clients. The challenge is to help the ABA identify any trends or patterns in these conversations that would help them provide better free legal services to low income families.
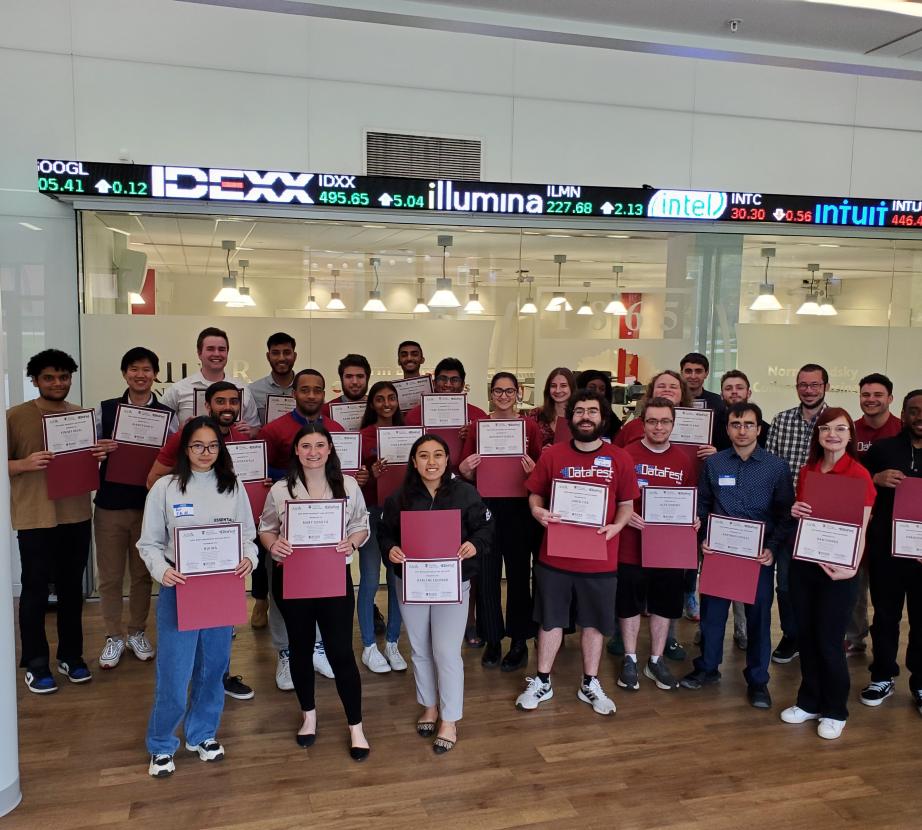
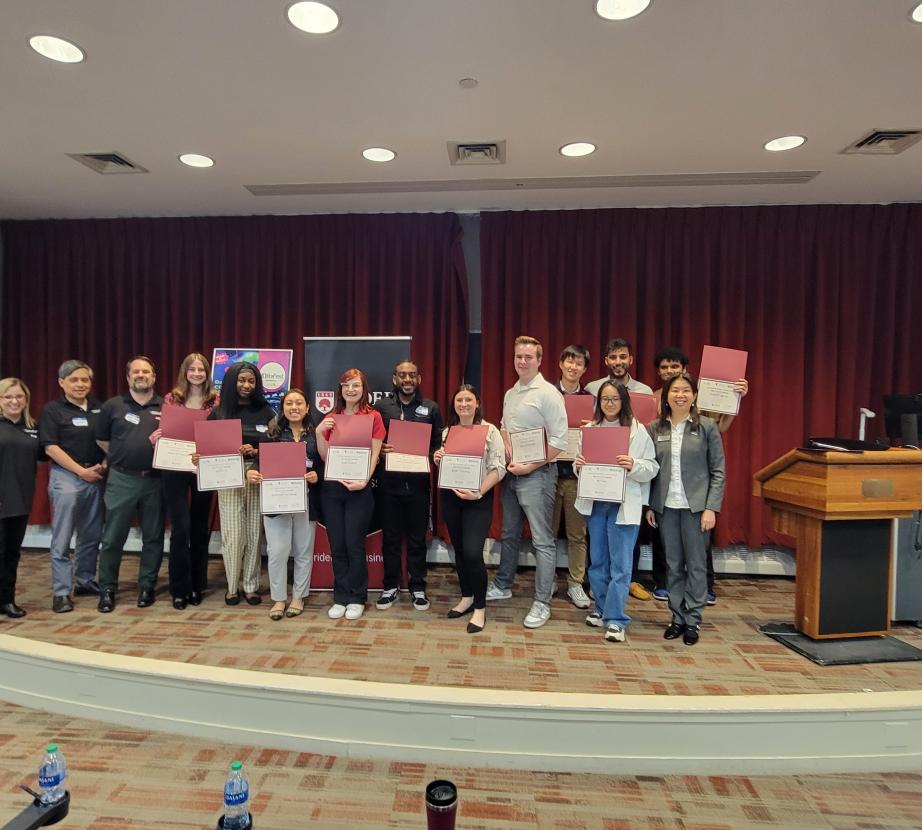
During the 48-hour event that began Friday, April 21 and concluded Sunday, April 23, 29 undergraduate students working in 7 teams competed against each other, including one team from Franklin & Marshall College. The student participants represent 12 different majors ranging from Accounting, Finance, Marketing, Business Analytics, Sport Management, Information Systems, Global Supply Chain Management, Management & Leadership, Business Administration to Computer Science, Cybersecurity, Mathematics, and Physics.
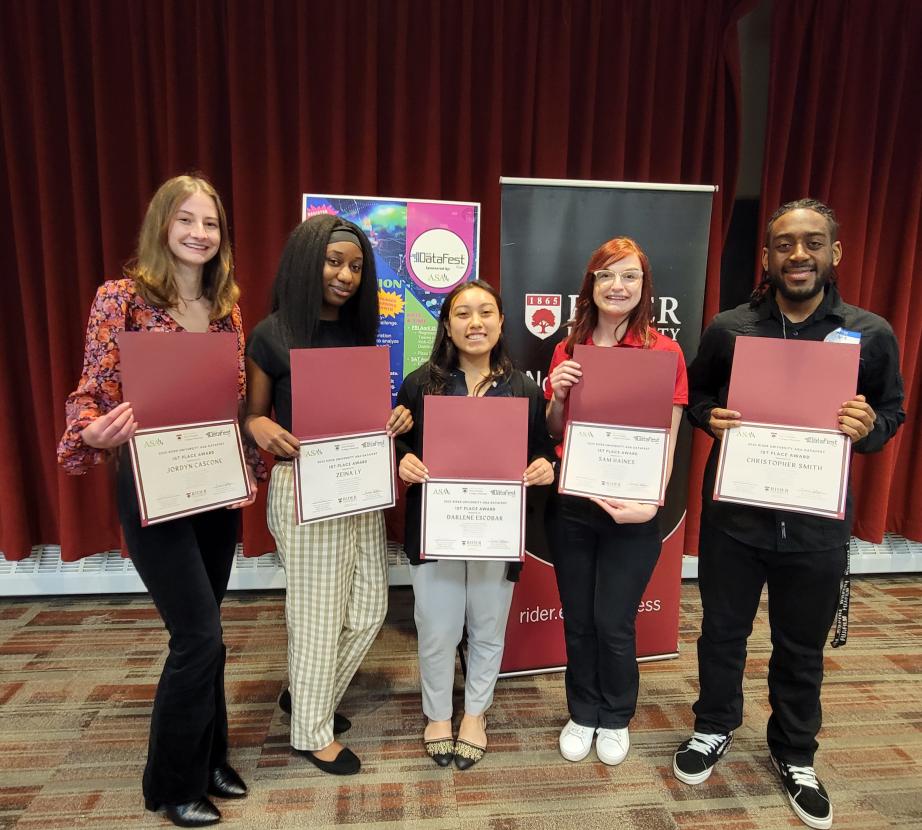
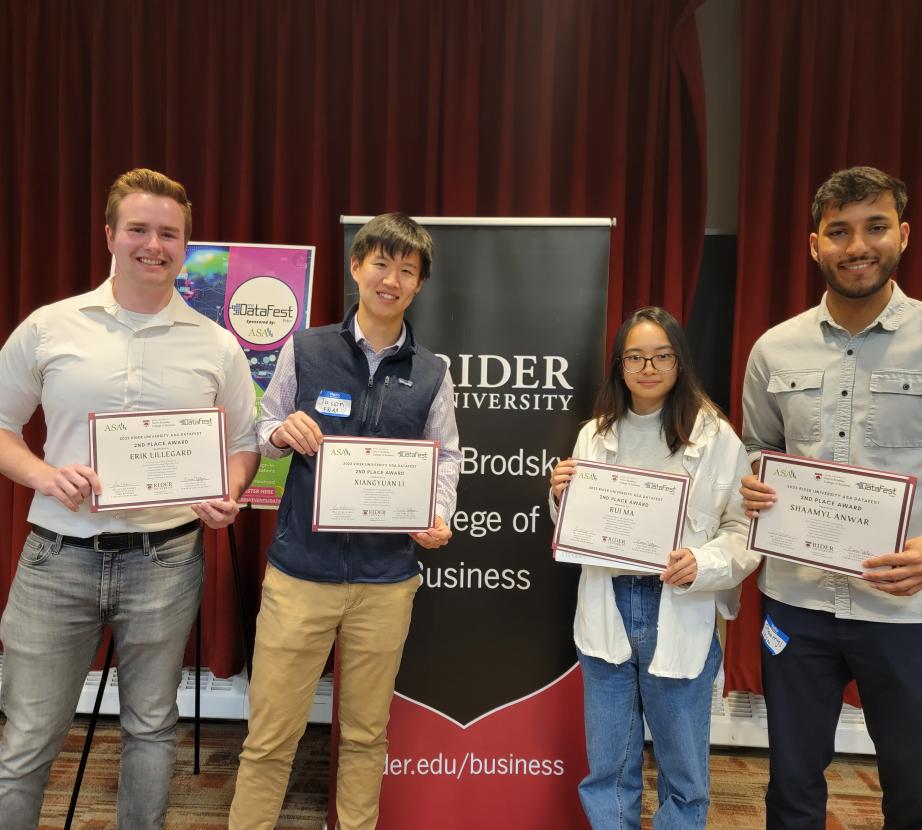
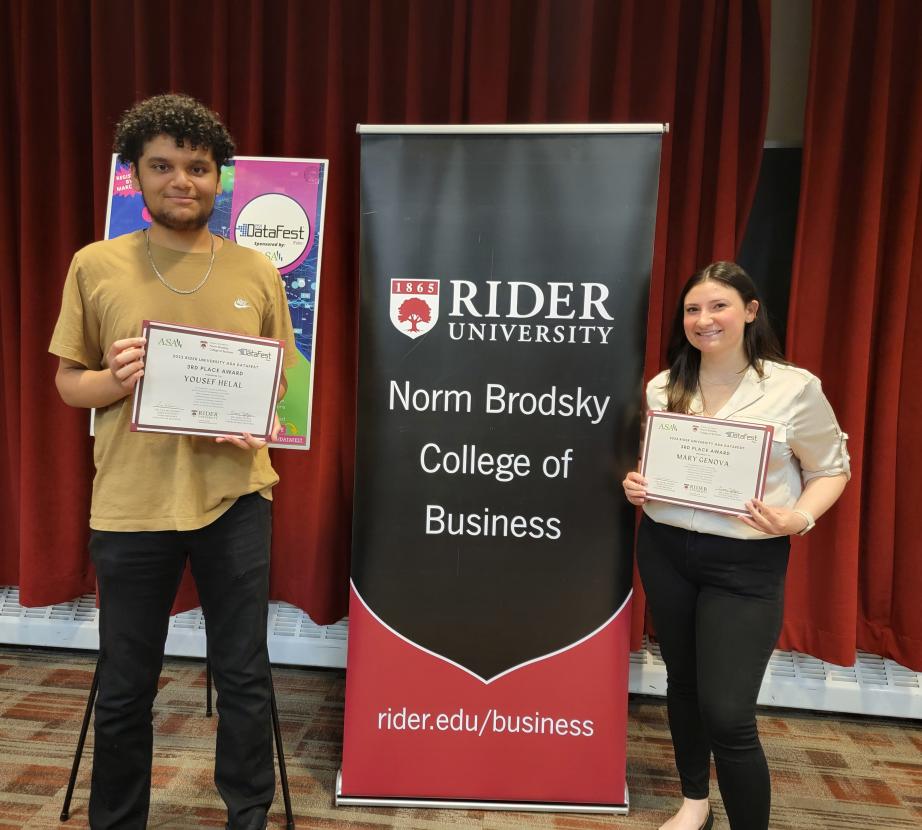
The team that won the first place and best presentation awards is Cup O’Java. The Cup O’Java team members are Darlene Escobar, Jordyn Cascone, Sam Haines, Zeina Ly, and Christopher Smith. Franklin & Marshall College team won the second place and best insight awards, and the data divers team won the third place & best data visualization awards. Franklin & Marshall College team members are Xiangyuan Li, Erik Lillegard, Rui Ma, and Shaamyl Anwar. The data divers team members are Yousef Helal and Mary Genova.
The DataFest competition presents a unique collaboration between academe, students, and industry. For students, DataFest is a resume-builder. Students take away a story to tell at future job interviews about how they met the challenges posed at DataFest, how they functioned under pressure, and how they would approach similar problems in the workplace. The DataFest also earn Rider students engaged learning points in the Guided Research & Scholarship category.
For Industry practitioners involved in DataFest, it is a recruiting opportunity for them. During DataFest, they get to identify students with the holistic skill set to navigate the “data deluge” - a highly valued skill set by many employers. Industry experts from Bristol-Myers Squibb, LGS Marketing Services, Fizzee Labs, NJM Insurance, Sanofi, and IBM served as mentors or judges for this year’s DataFest.
For faculty, DataFest can be helpful in revealing some of the knowledge gaps that exist in the current curricula and providing the ground for continuous improvement.
This year’s DataFest participant Sam Haines said in the post event survey, “Datafest not only allowed me to build my data analysis skills, it also allowed me to grow as a leader and create a picture for overall business impact.”
This year, DataFest was held in 52 other locations around the world. Rider is proud to be the only official host in New Jersey. More than 100 institutions participated in this year’s DataFest including some of the most prestigious colleges and universities around the world, such as Duke University, Smith College, Carnegie Mellon University, UCLA, University of Toronto, Purdue University, and Georgetown University.
Each year, the data and the challenge are different, but the common theme of making sense of Big Data—larger and more complex than the data sets students usually encounter in a classroom—is carried over. Below are some of the previous datafest challenges in recent years –
2022 – Play2Prevent Lab, Yale School of Medicine
Goal: Analyze game logs of the Elm City game to determine if there are coherent styles of play that might be useful for characterizing middle school students’ attitudes towards risky behaviors.
2021 – Rocky Mountain Poison Control Center
Goal: Provide advice for medical professionals that could identify potential misuse of prescription drugs. Data consisted of over 10,000 responses to an international survey about prescription drug use.
2019 – Canadian National Women’s Rugby Team
Goal: How do we quantify the role of fatigue and workload in a team’s performance in Rugby 7s? How reliable are the subjective wellness Data? Should the quality of the opponent or the outcome of the game be considered when examining fatigue during a game? Can widely used measurements of training load and fatigue be improved? How reliable are GPS data in quantifying fatigue?
2018 – Indeed
Goal: What advice would you give a new high school about what major to choose in college? How does Indeed’s data compare to official government data on the labor market? Can it be used to provide good economic indicators?

